Project lego - cloud connection - eaton
overview
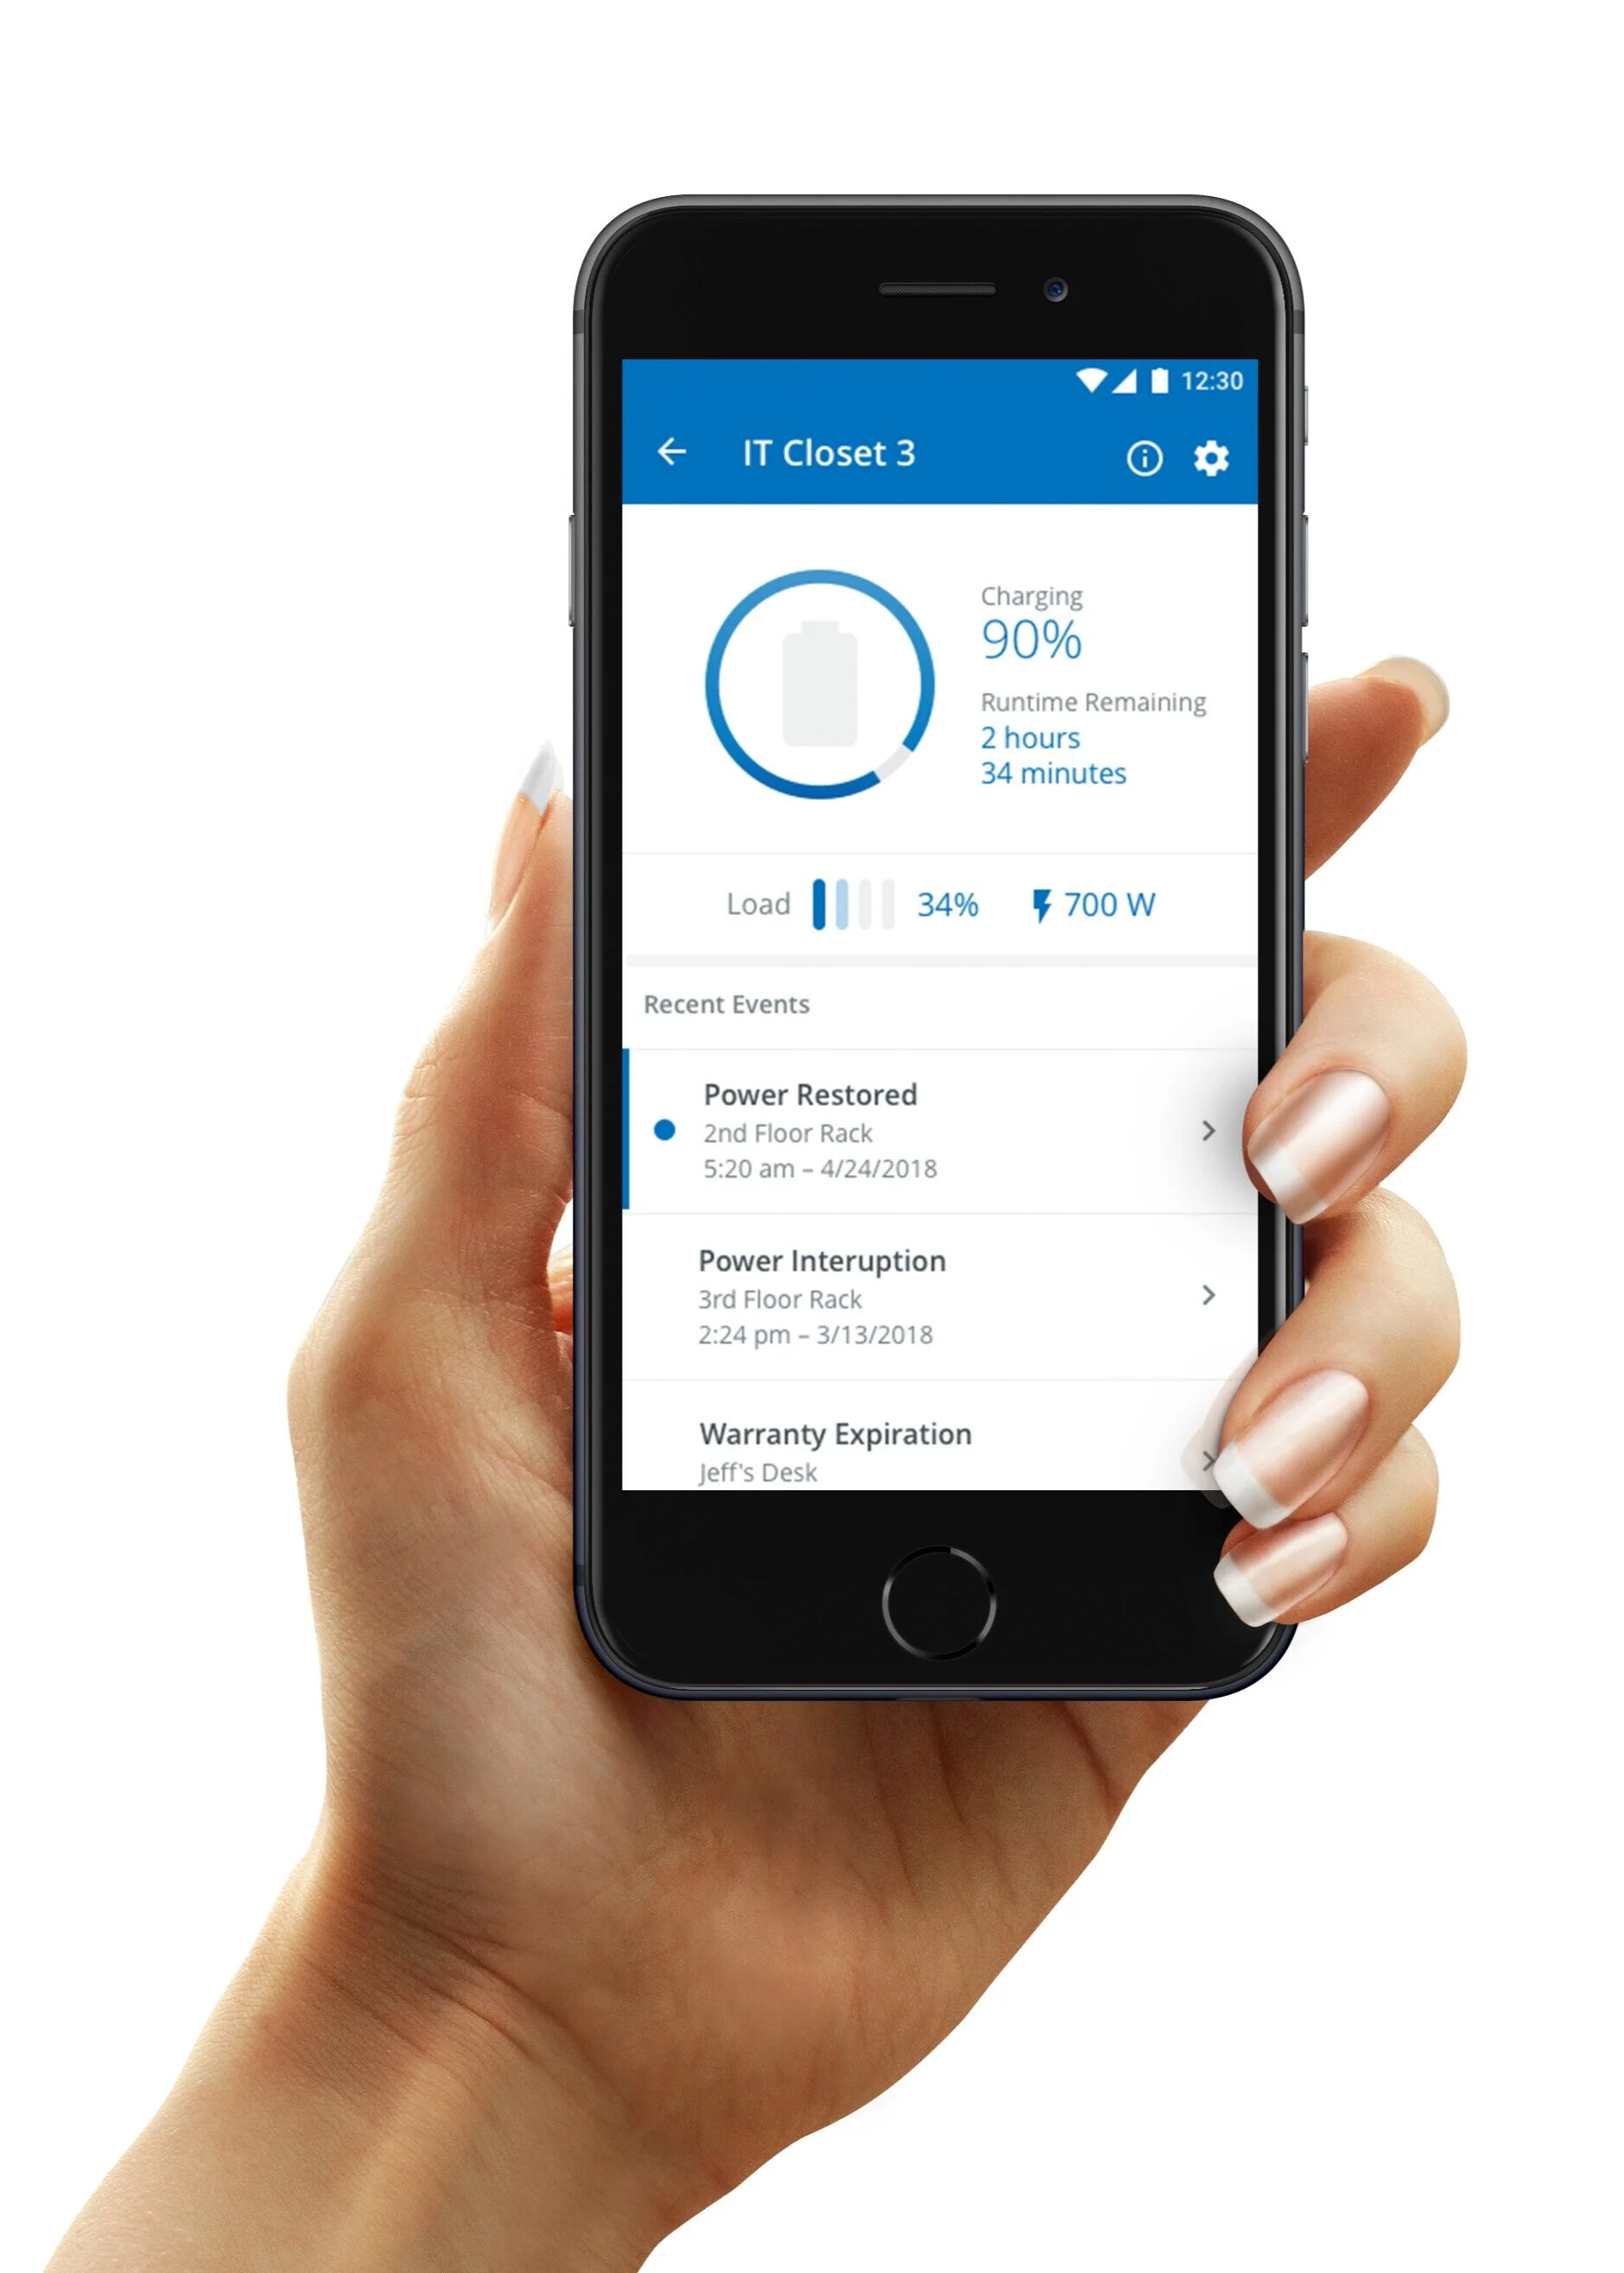
A UPS (interruptible power supply) is the unsung hero of IT infrastructure. It supplies critical backup power during outages. As a companion to Eaton’s UPS lineup, the Cloud Connect app expedites product registration and allows users to remotely monitor and manage their UPSs throughout their life cycle.
The Problem
When the person monitoring the UPC’s is not at the location they were not able to have a clear view of the status of their back up systems. They need to feel confident that their technology is online while having the ability to alerted them when necessary
FINDING A SOLUTION
User Experience Scale
User experience scale
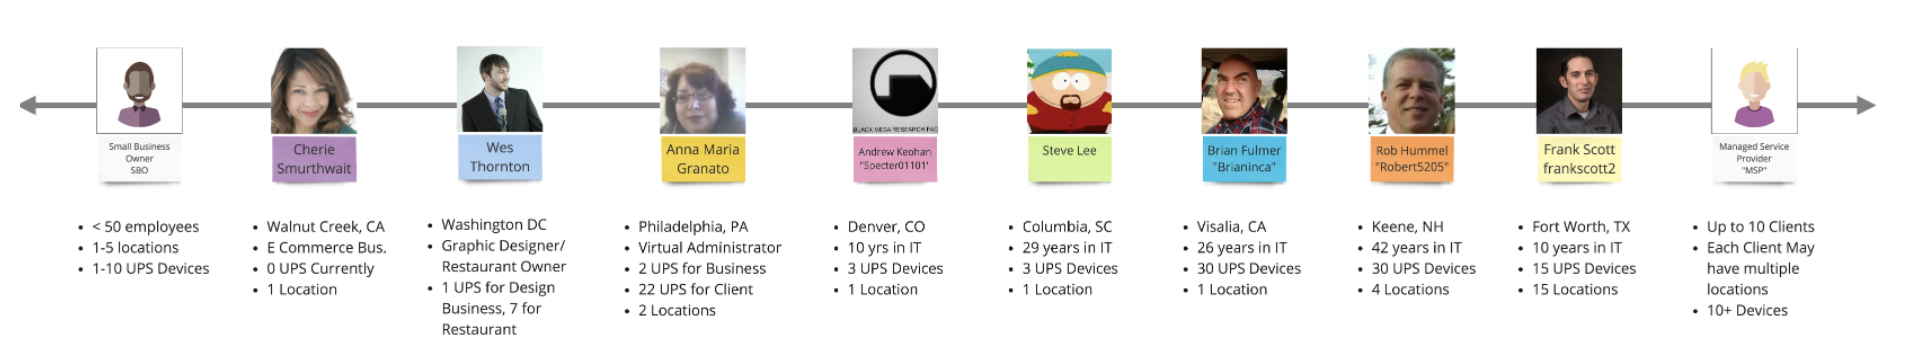
In this phase of planning we created a scale to visualize the user’s level of experience.
This helped us narrow our focus to the specific customer the product would benefit the most.
Affinity Diagram After Testing
AFFINITY DIAGRAM/synthesis
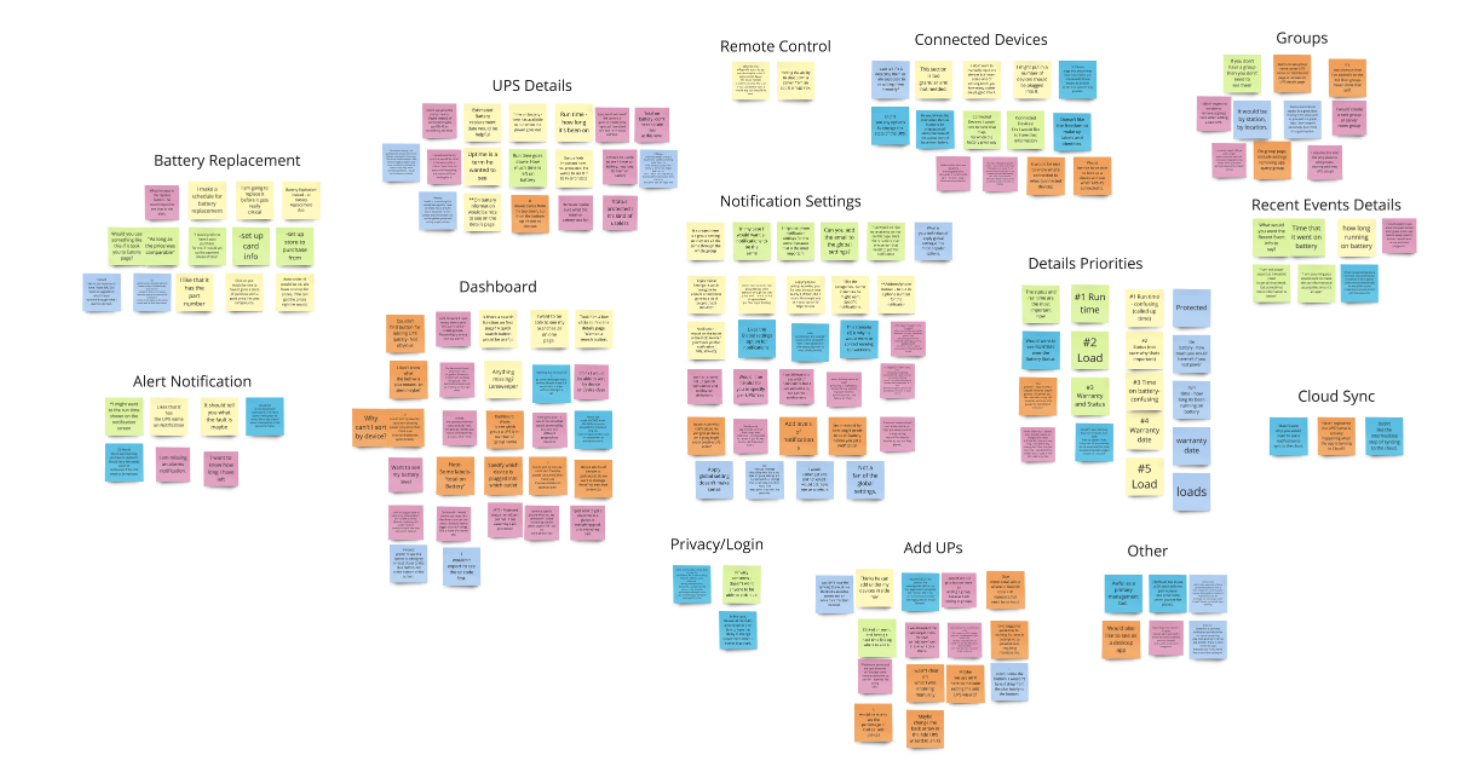
After the interviews all of our stakeholders and people on the user experience scale we used this method to organize our findings and group them into similar categories.
Key Finding #1:
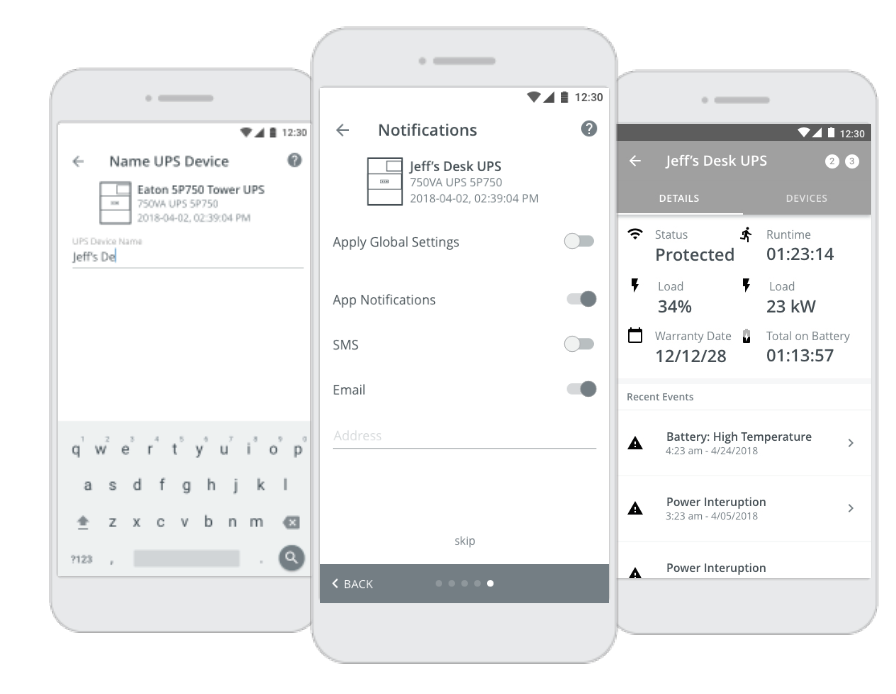
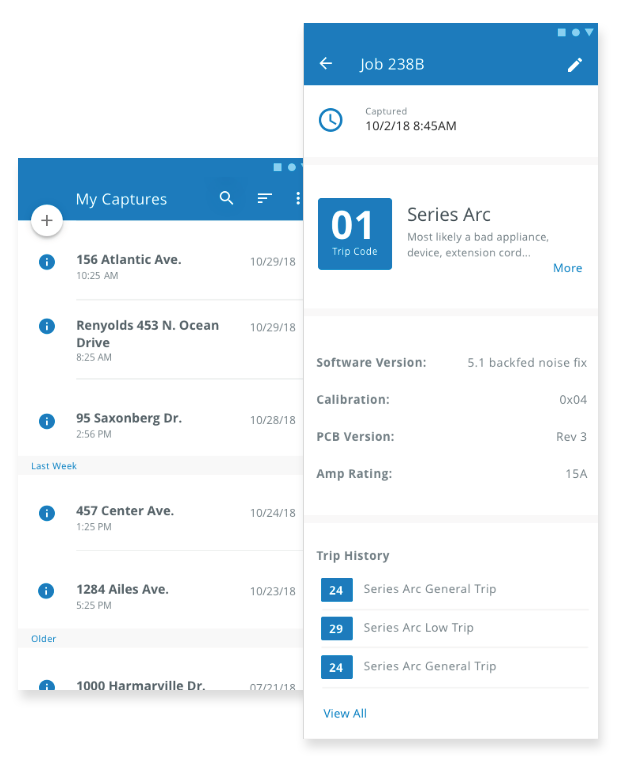
Users wanted to quickly determine the root cause of events.
Solution: Revised work flow to show critical info immediately.
Key Finding #2:
We need to make connections between devices that have concurrent events.
Solution: Revised events list to emphasize the time of each event.
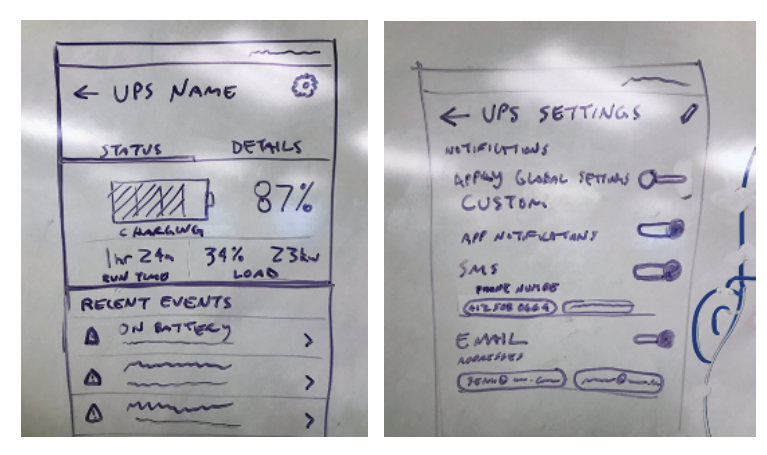
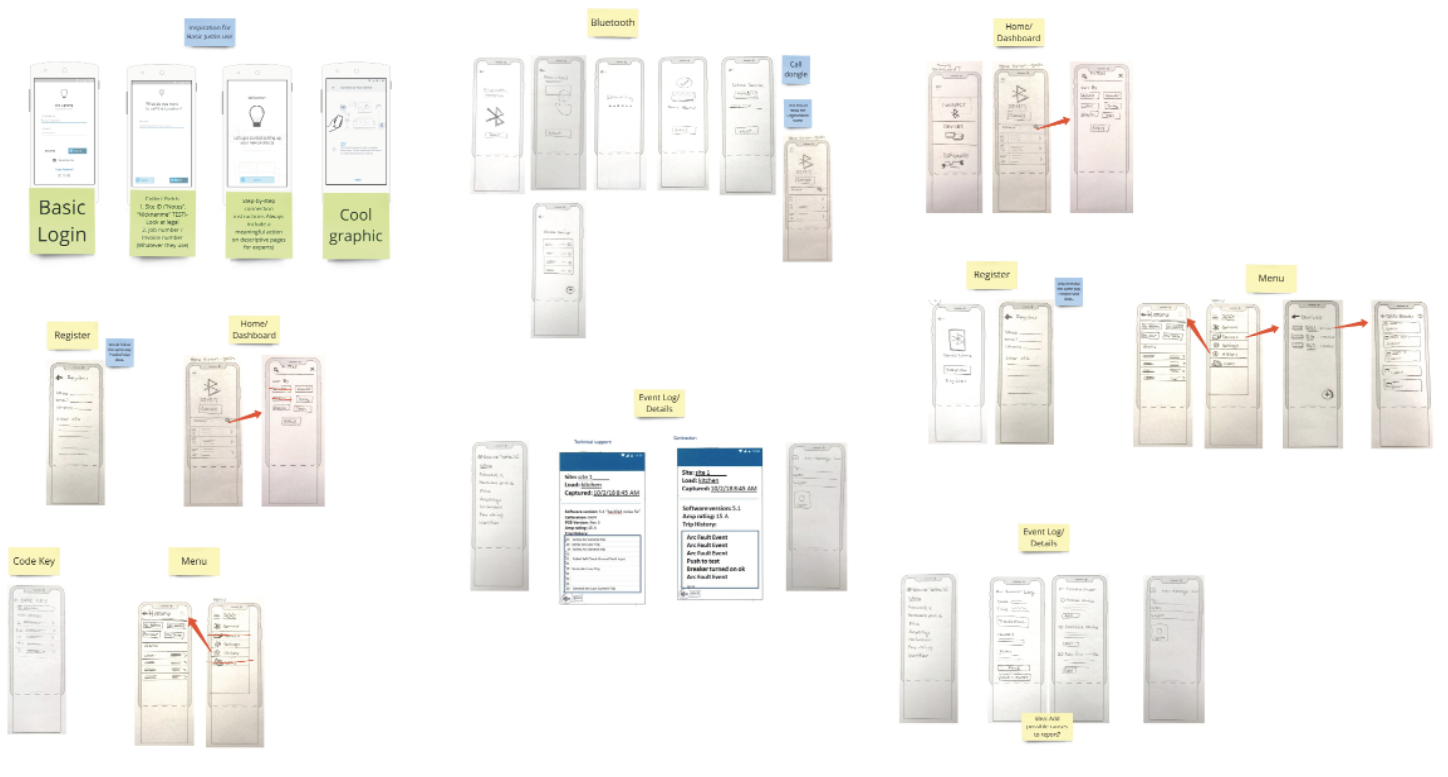
Low Fidelity Screens
Medium Fidelity Screens to Create Prototype for Testing
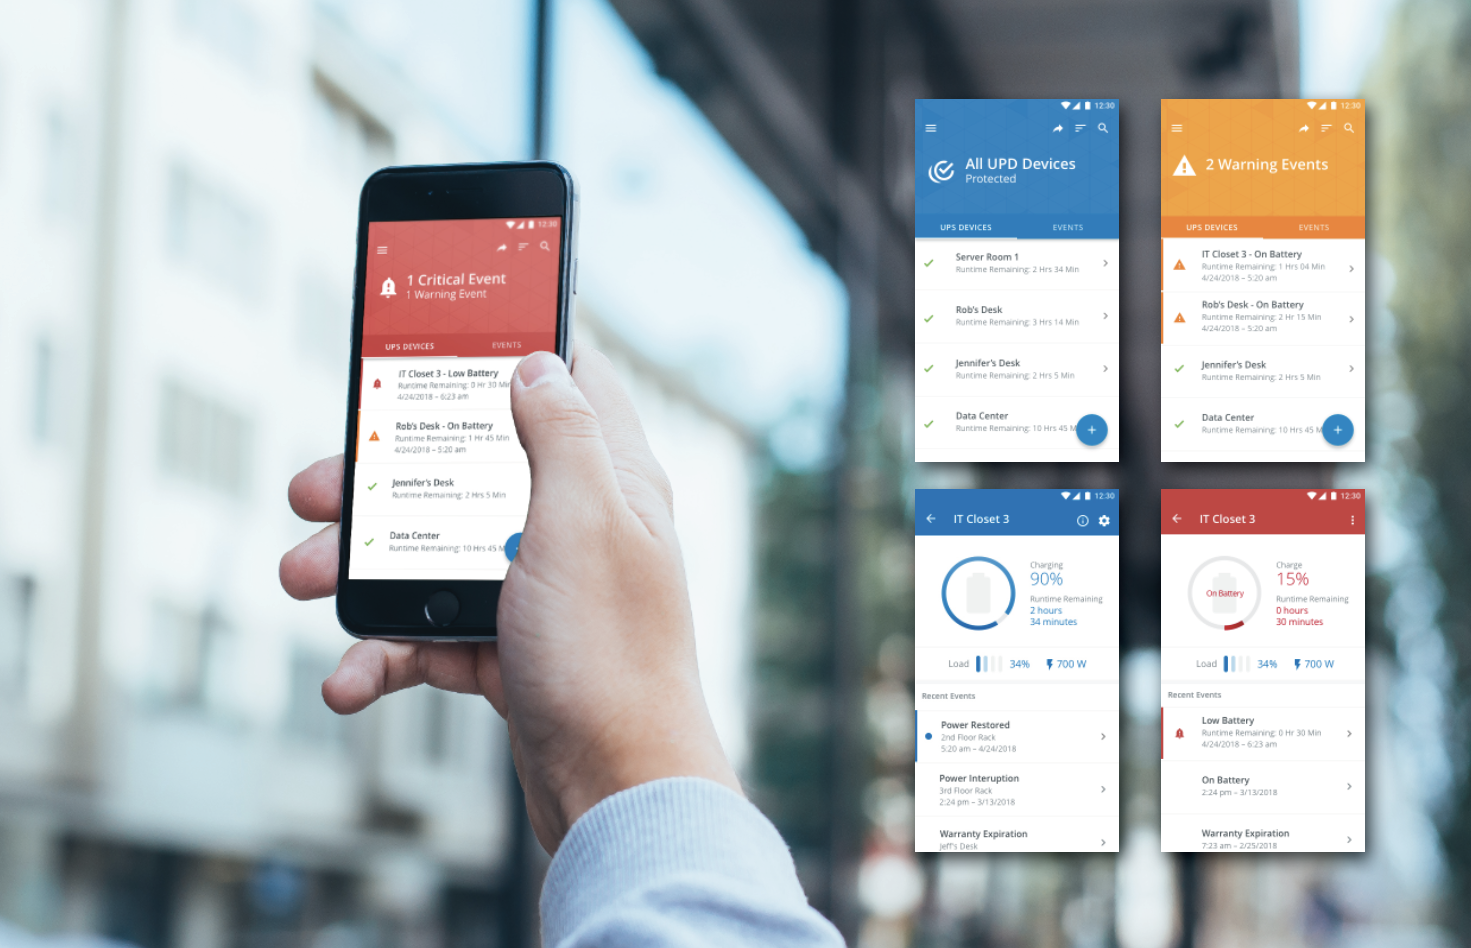
High Fidelity Screens - Final Product
reflection
When you are creating an application that has an alerting system in place, it is all about the customer feeling secure. The need to know that things are working properly and also have the assurance that they will quickly be alerted when there is a change or situation happening.
Project Lego was a project that helped me understand the importance of security and alerting systems. I went into this project with many assumptions and quickly learned that sometimes my assumptions were a little off. This project was really interesting because of the range of users. I had to take into consideration that some people were managing 5 units and others were managing hundreds.
trip code reader - eaton
overview
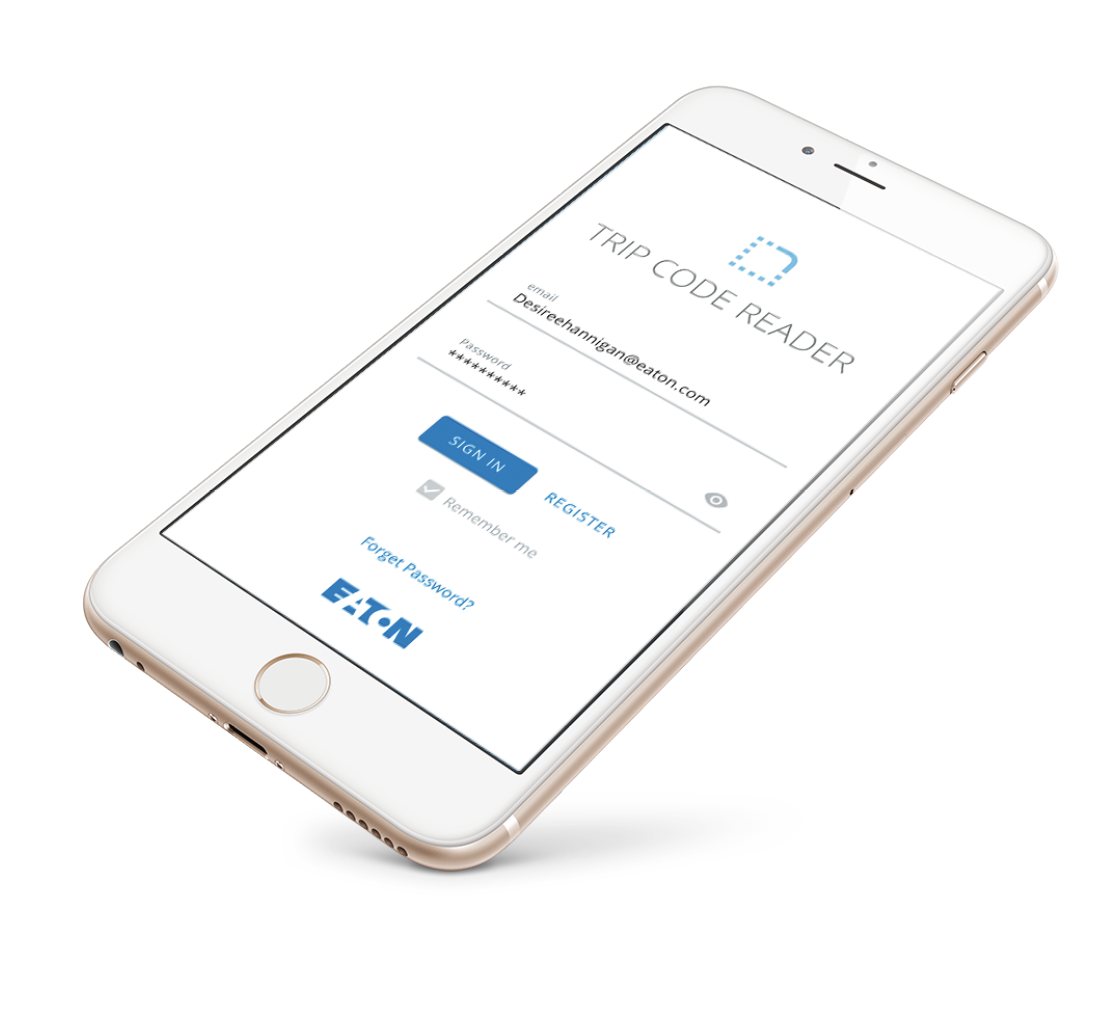
The Trip Code Reader brings smart connectivity to residential circuit breakers. The device reads a series of blinks from the Eaton’s Thermal Guard breaker and transmits to a mobile device via bluetooth. The app helps electricians and Eaton support technicians quickly diagnose and troubleshoot these errors in the field.
The Problem
Electricians want an easy way to understand why a circuit breaker has tripped. A lot of times they are coming in blind to a problem and try to either recreate the problem or make assumptions. They want and way to build confidence and have a tool help them diagnose any issues.
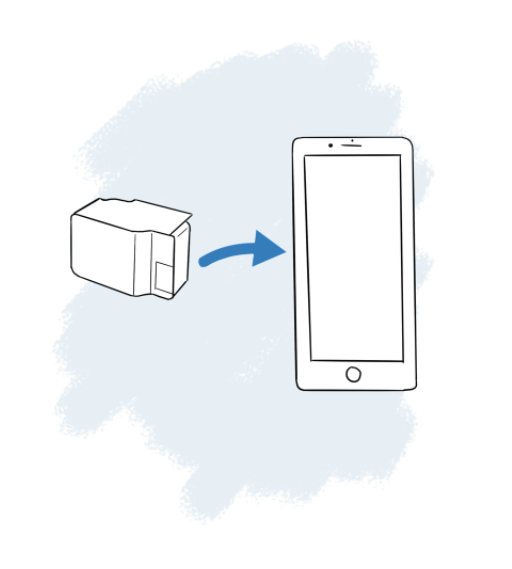
what is the technology?
The Trip Code Reader is a small device placed over the circuit. This small device uses bluetooth technology to read and send information to a mobile device to display the latest error codes for that particular circuit breaker.
understanding our users
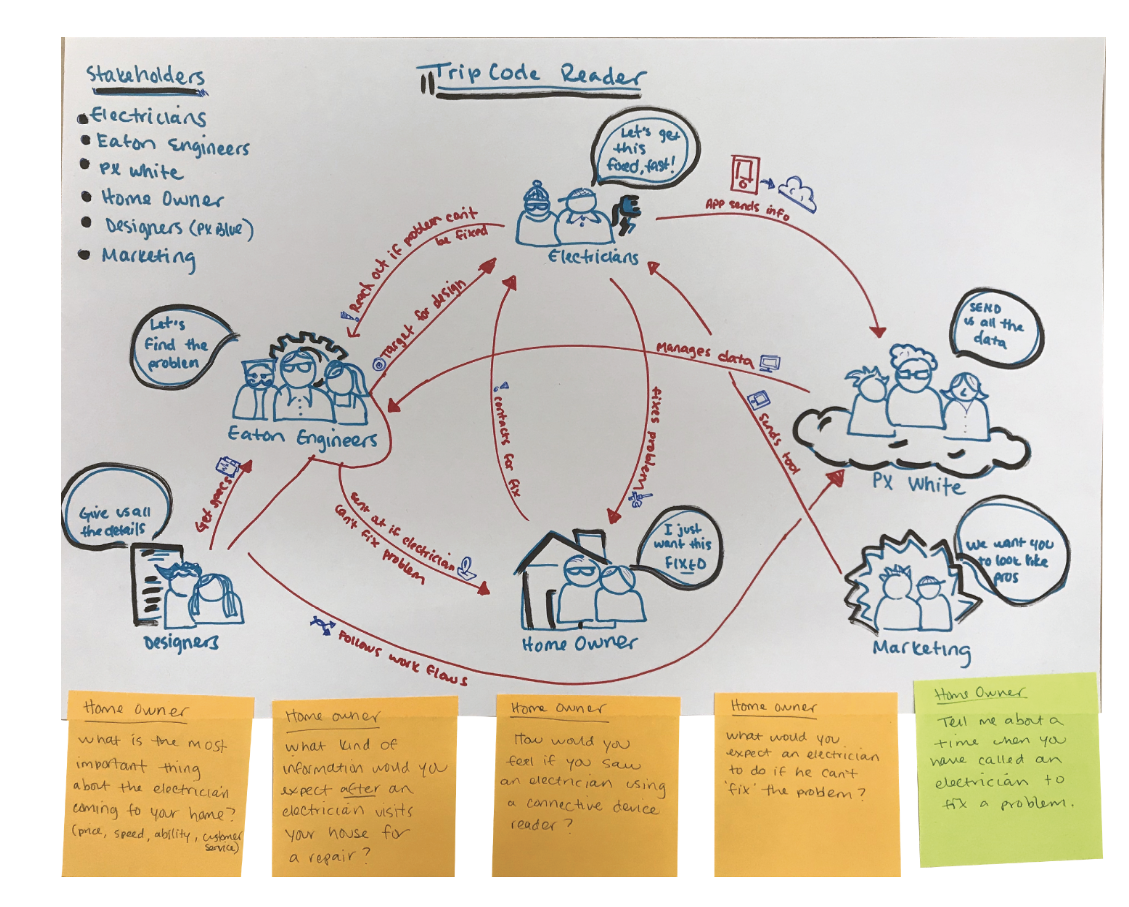
Stakeholder Mapping
Work flow planning
How might we prevent errors and enable electricians to have the information they need to quickly diagnose a problem?
One of my challenges was this was this technology requires a little tiny dongle to be present. So managing devices become a little complicated. Do you register each dongle or do you have an account where you can store your latest reading? What if you lose your dongle?
Secondly not customers were tech savvy. We had to make this very straight forward and even found that we had to give the app a little extra breathing room so the buttons were very clear and had a lot of space around them.
With this information in mind, we were able to really create something that was not only helpful but electricians were really excited to have this information. It helped them and the people they were servicing feel really confident.
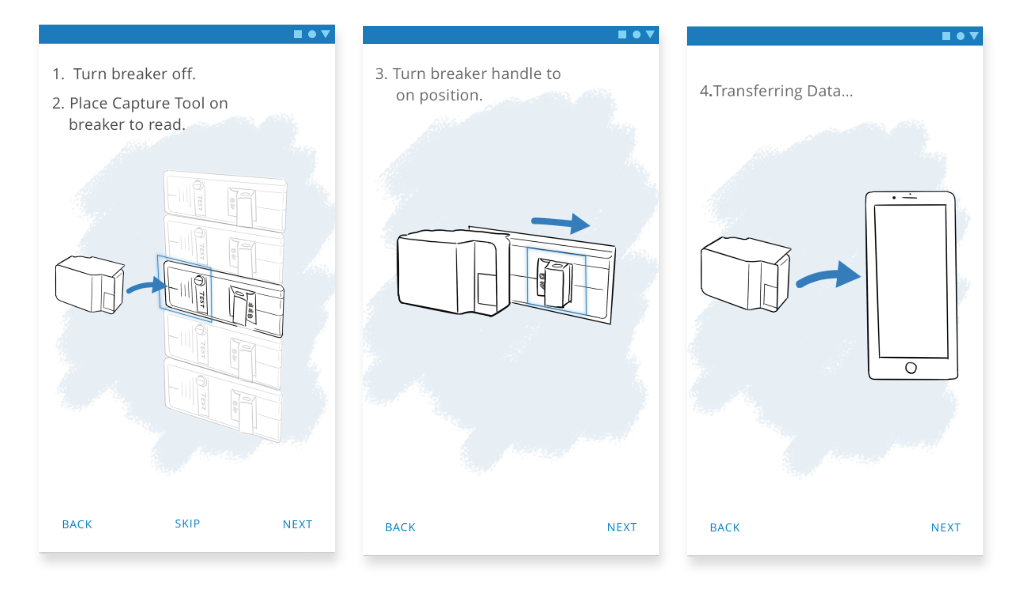
Illustration tutorial
reflection
This was a big effort in syncing our internal technical teams with our people in the field. This was a really great opportunity to not only arm our electricians with helpful/impressive tools but to give Eaton a ton of data.
I really got to understand the struggles of going into a job blind. I also got see the relief that comes with getting this information. It was really rewarding and exciting to watch it unfold. The next step is to create a useful system that would provide a way to organize and view all the data that is being captured with these reading. So there is a lot of exciting opportunity there as well!
price changes - dicks sporting goods
overview
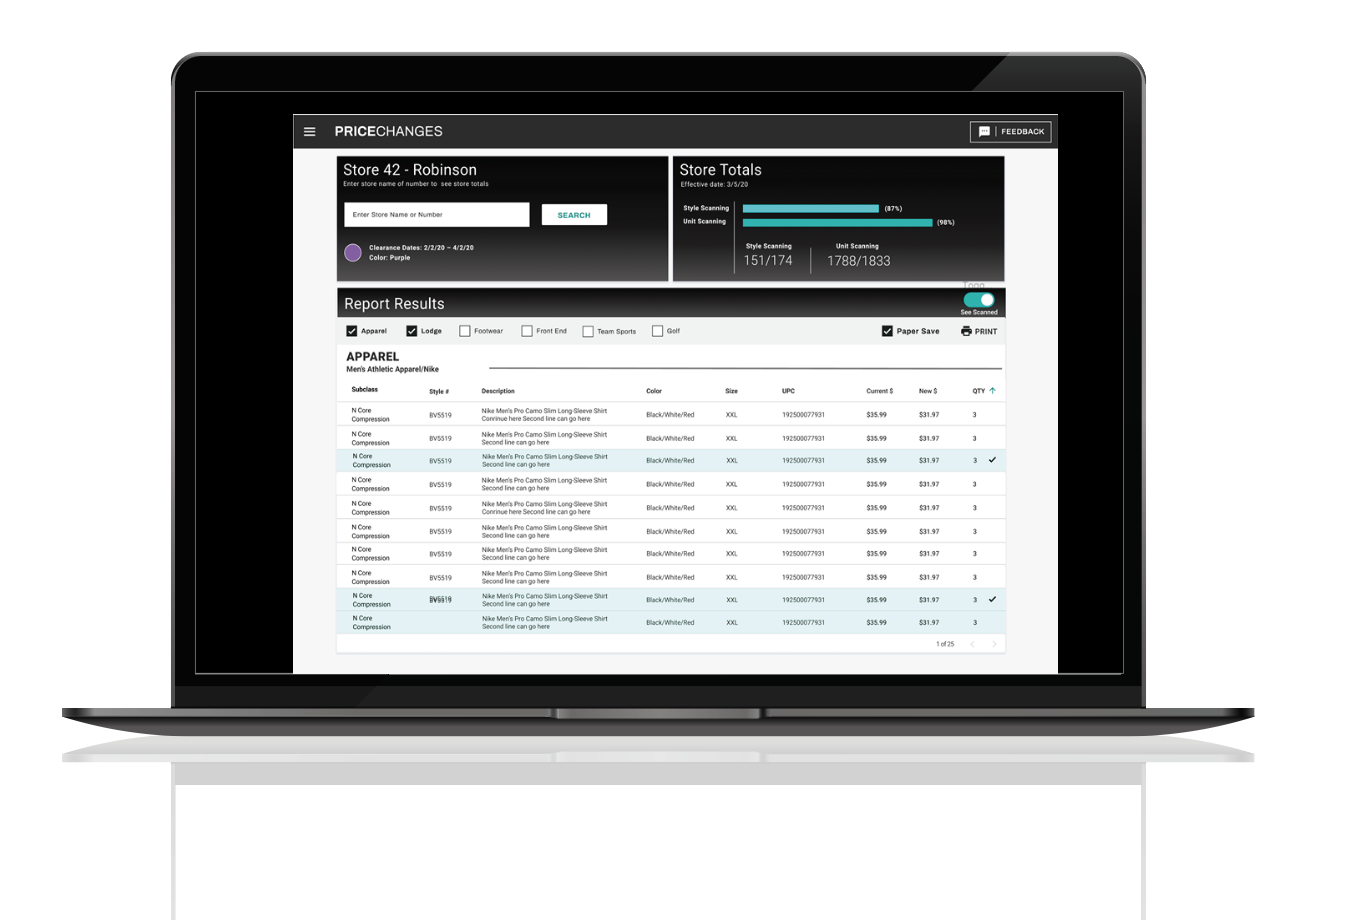
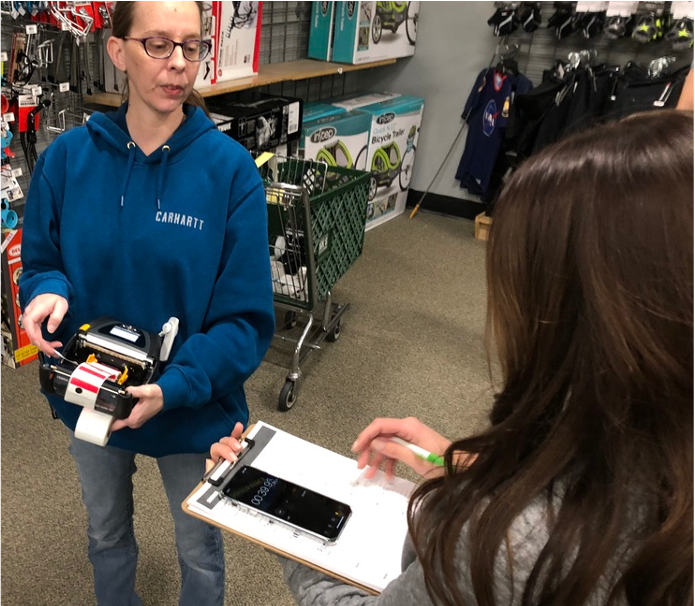
Scan and Activate is the process in which an employee scans the goods in the store and marks them with a new price if needed. This is a very old outdated process and also has the highest turnover rate in the store. The employees were working off a spreadsheet and a highlighter. Our goal as a team is to understand the struggles and the processes inside and out so we can make it more enjoyable and more efficient.
The Problem
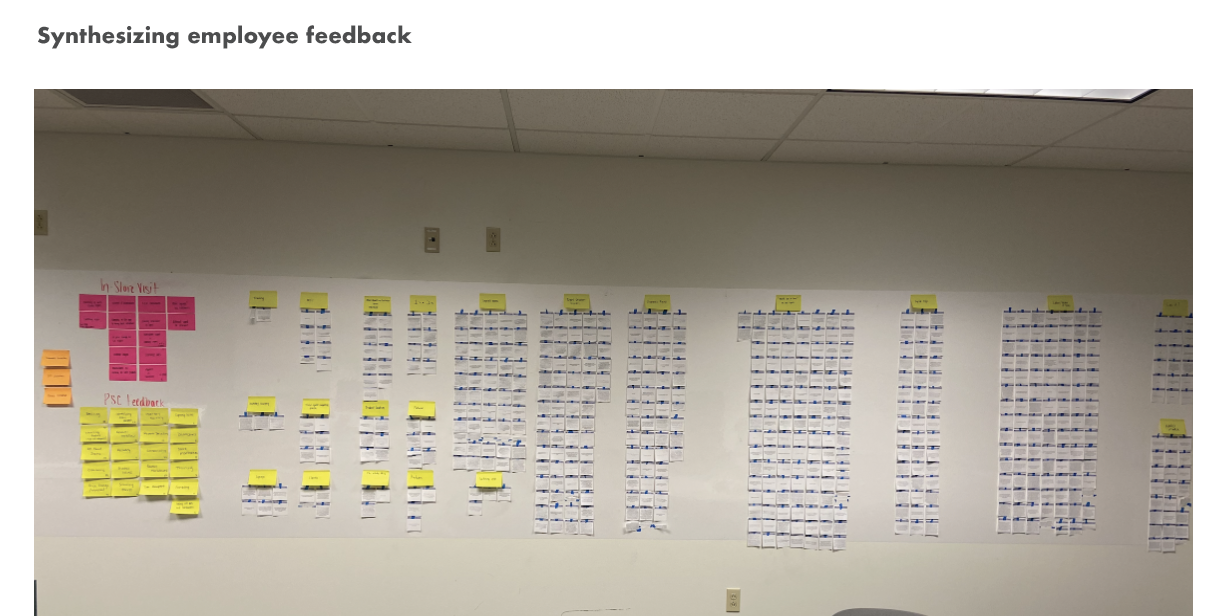
We gathered thousands of pieces of feedback and worked many hours in the stores with the employees to truly empathize and understand what was going on. We used all this information to define the broken processes and create a better one. They were taking a long time to complete the tasks needed and had many struggles along the way. I am showing some of the design activities I did to gather that information, understand the problems and prioritize what needed to be done. I was the only designer working on this team and leading these efforts along side 1 product manager 3 engineers. There was a ton of opportunity and we created a solution that improved the process while saving the company money. We received a lot of positive feedback from grateful employees, which in my opinion was the best part.
Across 756 stores, per year, this will save approximately 48,562 labor hours which is an estimated $631,309 of labor savings.
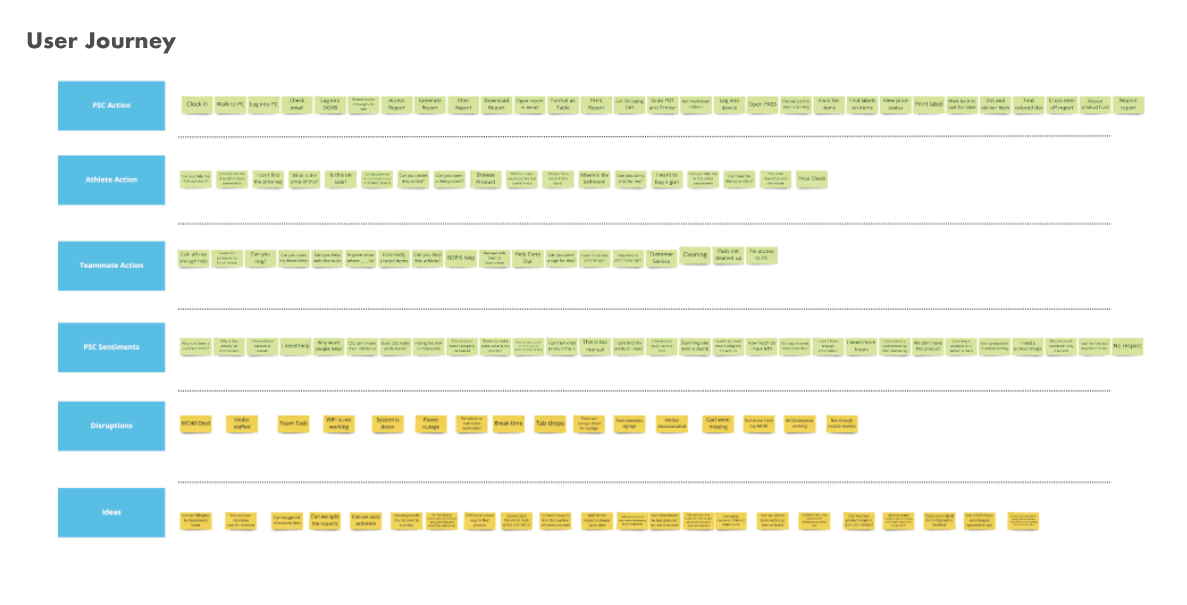
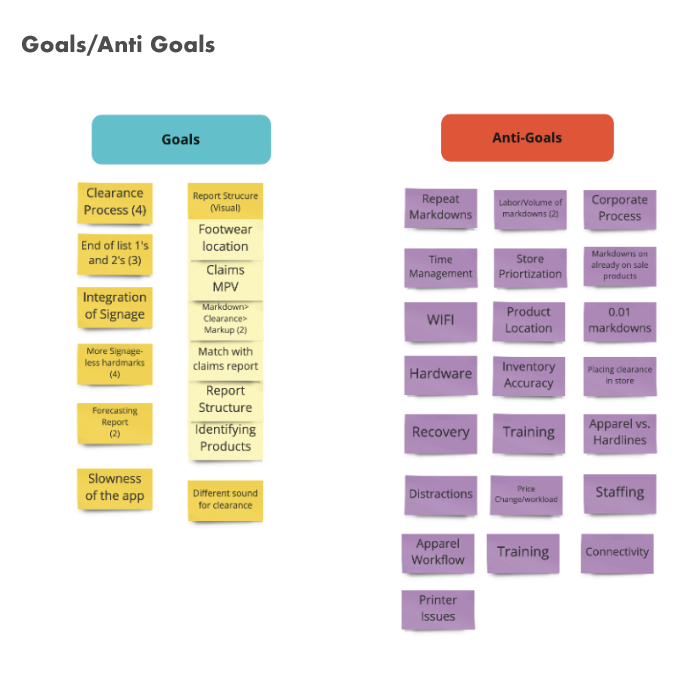
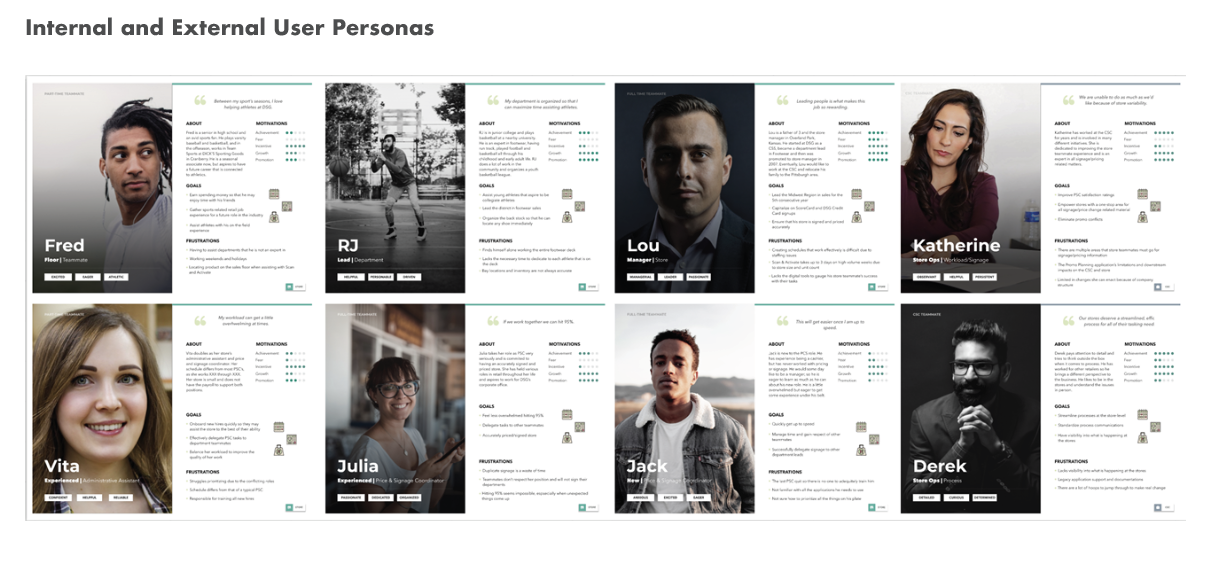
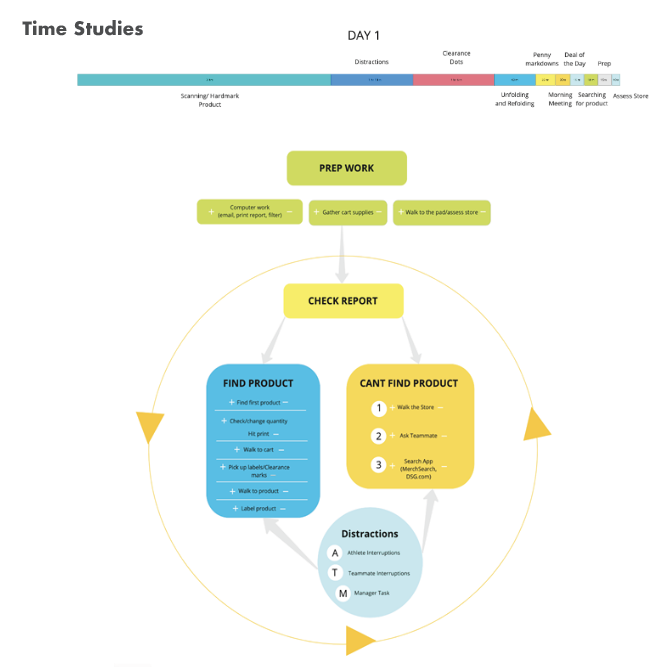
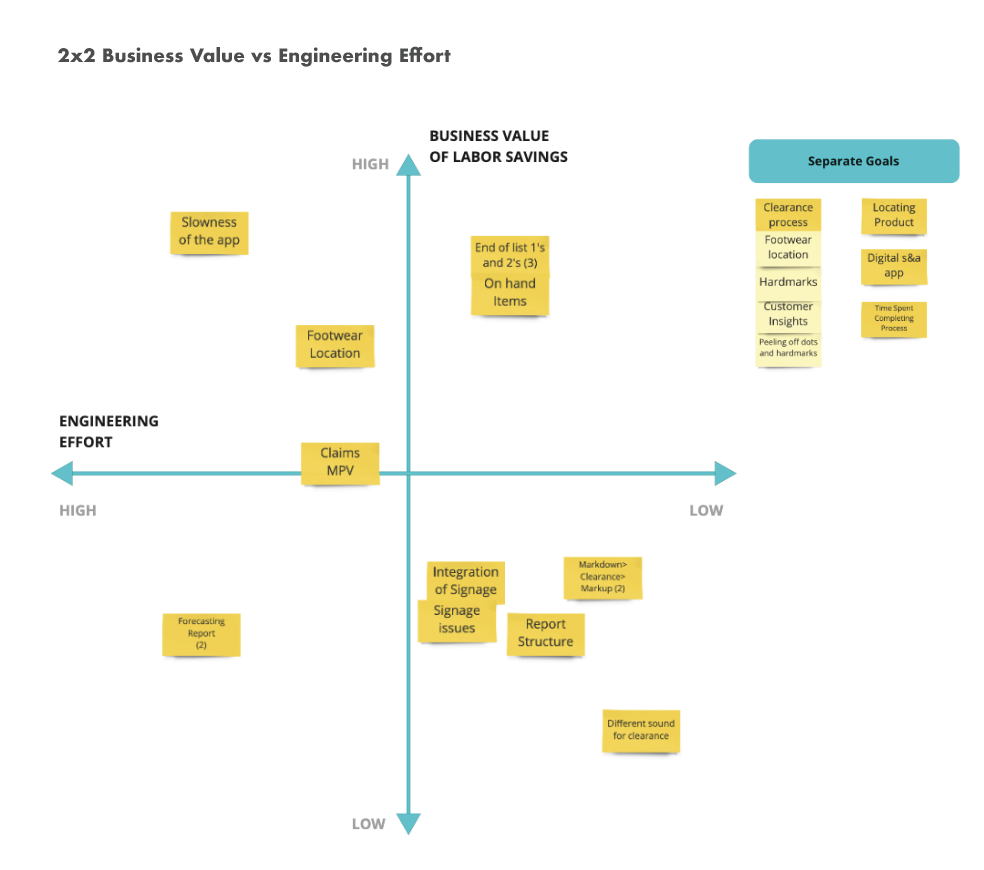
understanding the problems and opportunities
This process truly a wholistic discover and framing activity. There were months taken working alongside our employees. We had to understand the reporting system from and internal standpoint, which housed thousands points of data that needed to be communicated each week, then deliver that information in a way that any employee could digest.
Above you will see some design thinking activities used to sort out some of this information.
RESULTS AND REFLECTION
Just changing one feature had really great results:
We found that we weren’t providing them with the bay location for shoes. This was adding about 3 steps of item search to find one shoe (x100+ shoes per week)! So we had this information and added it to the report and…
Before:
3min. 23 sec. to find a shoe’s bay location
Avg. # of shoes on footwear week = 100
100 shoes x 3min. 23sec. = 6 hours 3 min
After:
1min. 5 sec. to find a shoe’s bay location
Avg. # of shoes on footwear week = 100
100 shoes x 1min. 5sec. = 2 hours 10 min
Across 756 stores, this will save approximately 48,562 labor hours which is an estimated $631,309 of labor savings per year. Just from adding one column of information on their report.
There has been so much positive feedback from our employees and we have truly made their lives better. They went from a paper spreadsheet to an interactive interface that helps them actually find items.
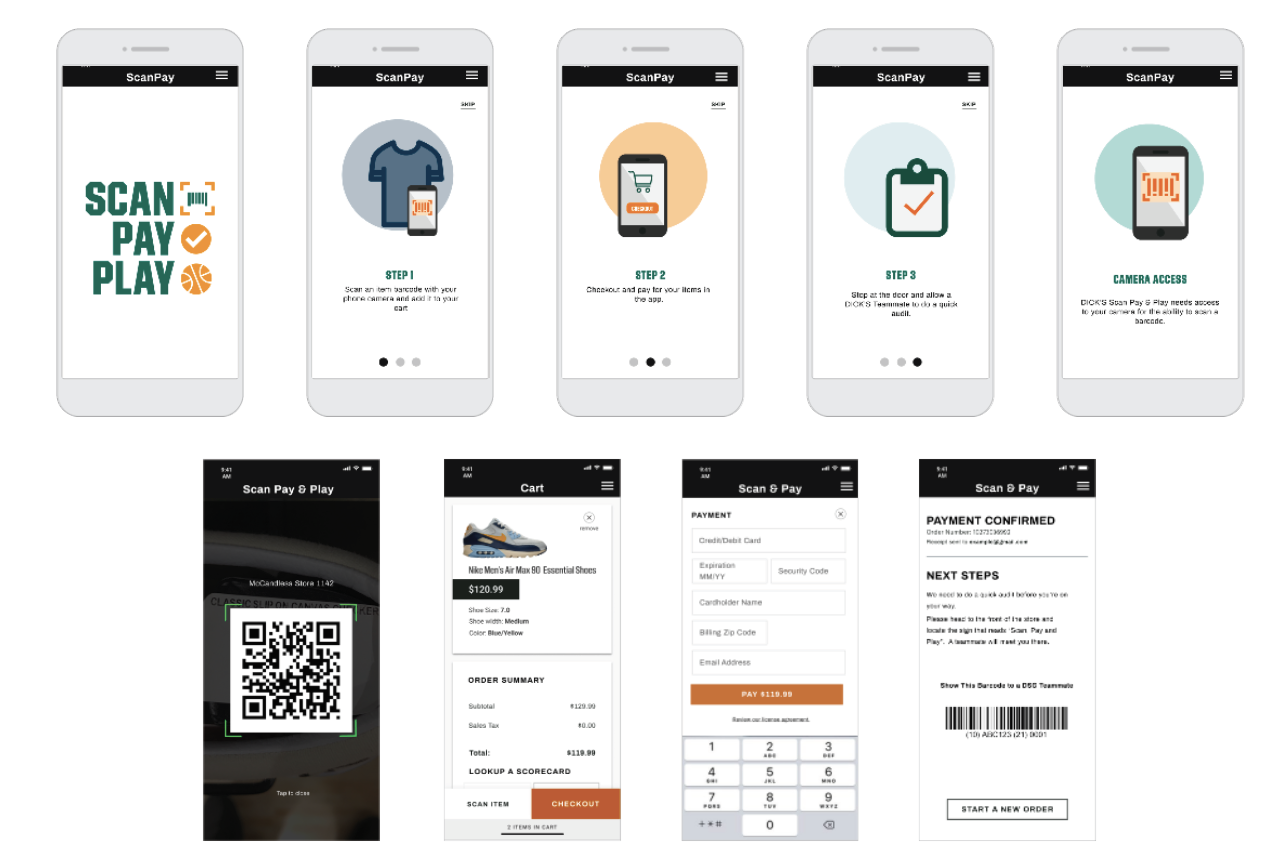
SCAN PAY AND PLAY CUSTOMER FACING APP-
DICKS SPORTING GOODS
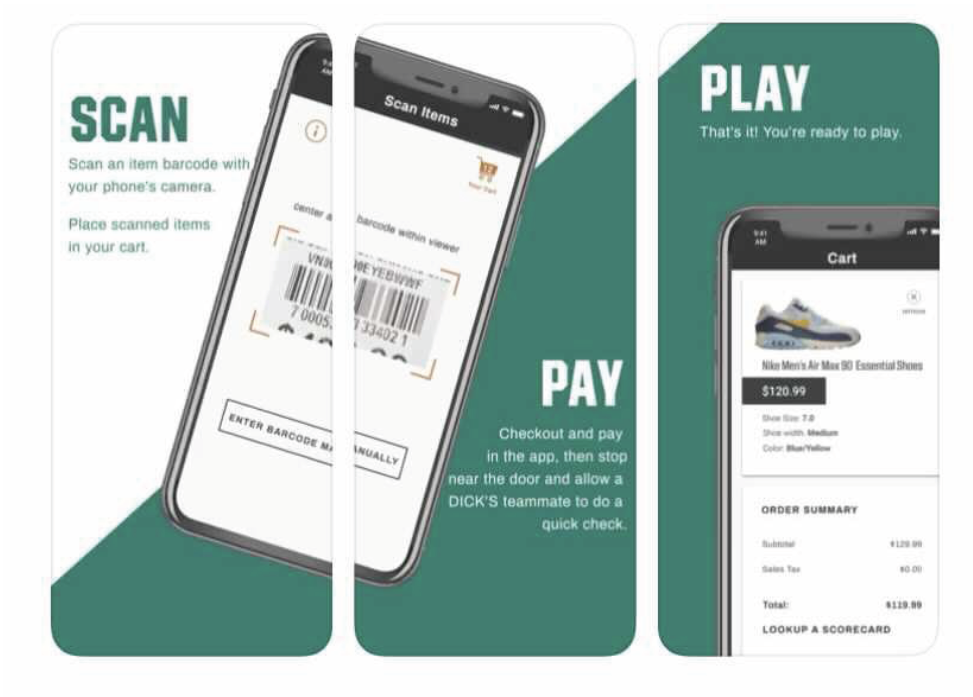
overview
Scan Pay and Play is a customer facing app that was designed in response to Covid-19. Dick’s Sporting Goods wanted to quickly respond to some of the line management challenges and health concerns that the customers faced while checking out in the store. This app was quickly designed with little research. It was handed over to my team to improve and research the current experience. My team started by conducting research and experiencing the app for ourselves while gathering user feedback. We had to work alongside many internal teams. This app currently is available to download on Apple and Android devices.
The Challenge
Since this app was originally designed with little research and by another team, we had to work backwards to address some of the issues. We also had no idea how the our customers would respond to a retail environment in response to a pandemic.
So we dove in and collected as much information as we could. This is what we found….
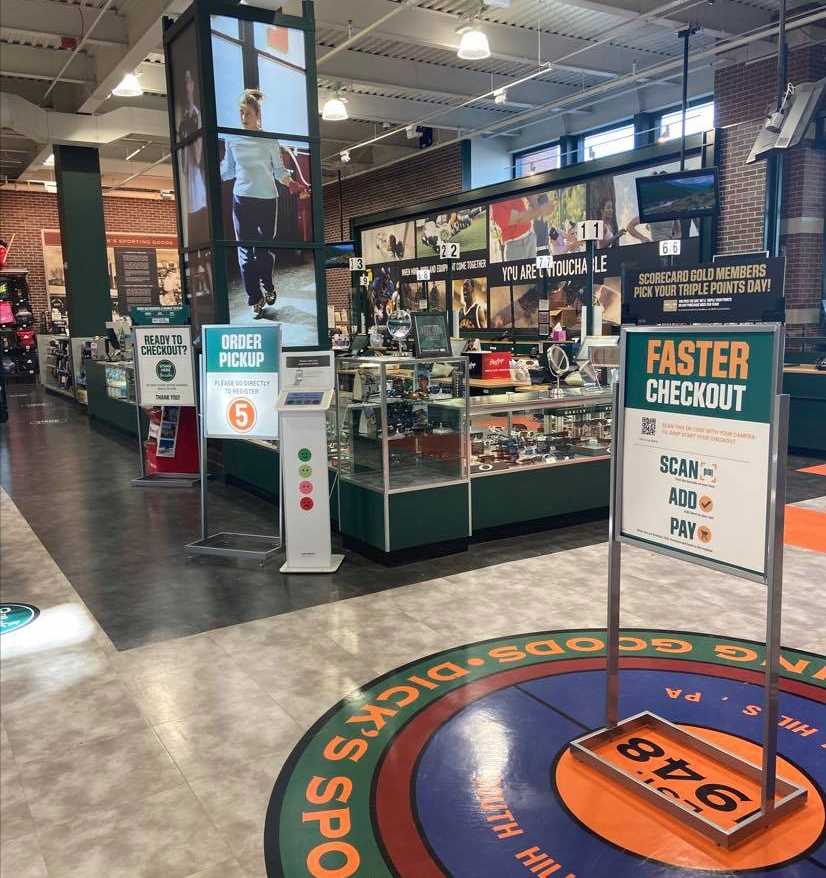
Too many messages in the store - check out was confusing.
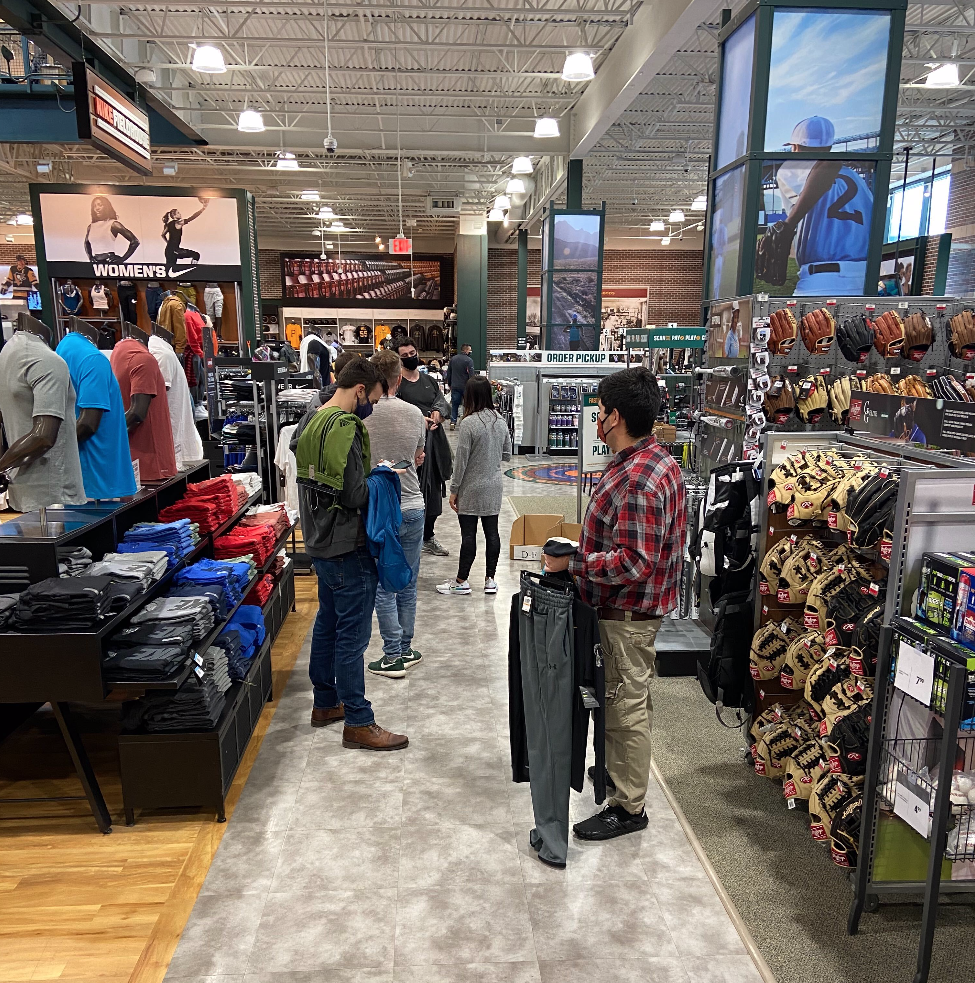
Before you leave the store you have to complete and audit with an employee to check your items and remove any sensor tags. If there was multiple people checking out using the app it could clog up the aisle.

This is feedback from our in-store experiences. We also had other shoppers we interviewed as well. We used this information to identify any immediate concerns and opportunities.
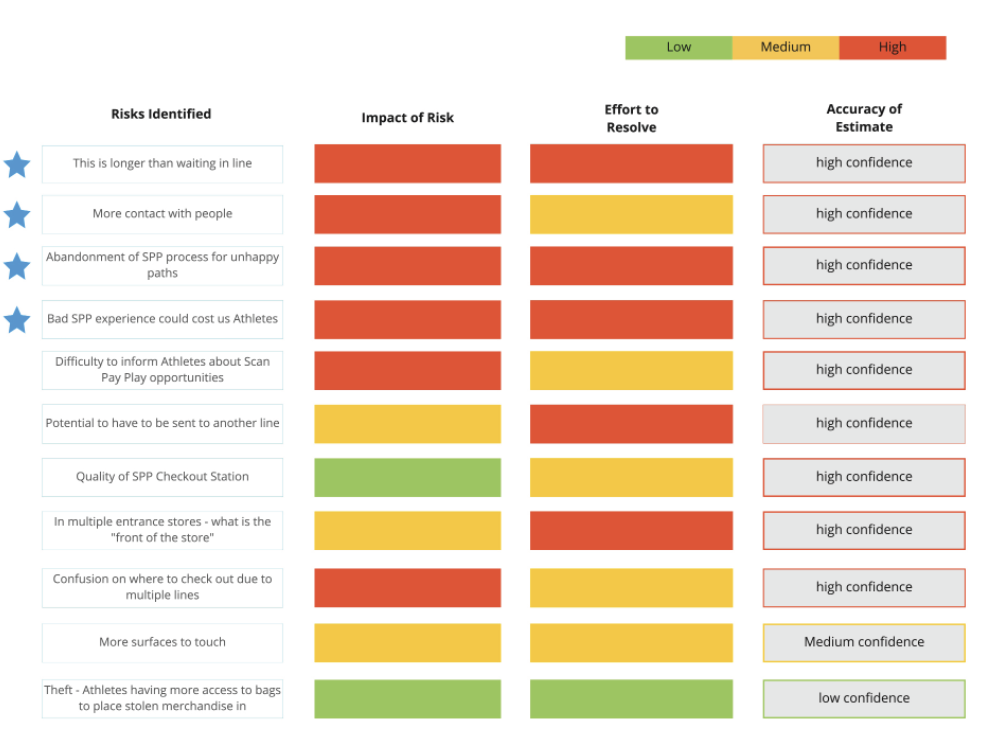
Risks Identified to help us decide what direction to take.
What we did with all this information was present it to the senior leadership so they could make an informed decision about how to move forward with this initiative.
Pricing screens were improved, more instruction was included and the we decided to use a better scanning service.
REFLECTION
This project was very interesting because it involved a lot of stakeholders and it was created to solve a problem that ended up not really being a problem. There was value the work that had been done, but finding the purpose for this app in an ever changing retail environment was uncharted territory.
My team updated some of the design flows along with some other payment updates. We continue to monitor the usage and sales metrics to understand if this will be a useful tool for our customers.