PRICE CHANGES - DICK’S SPORTING GOODS
OVERVIEW
Scan and Activate is a process where employees scan thousands of items in the store each week and update their prices as needed. This outdated system relies on employees working with a spreadsheet and a highlighter, contributing to the highest turnover rate in the store. As a product team, our goal is to fully understand the challenges and intricacies of this process so we can make it more efficient and enjoyable for employees.
The Problem
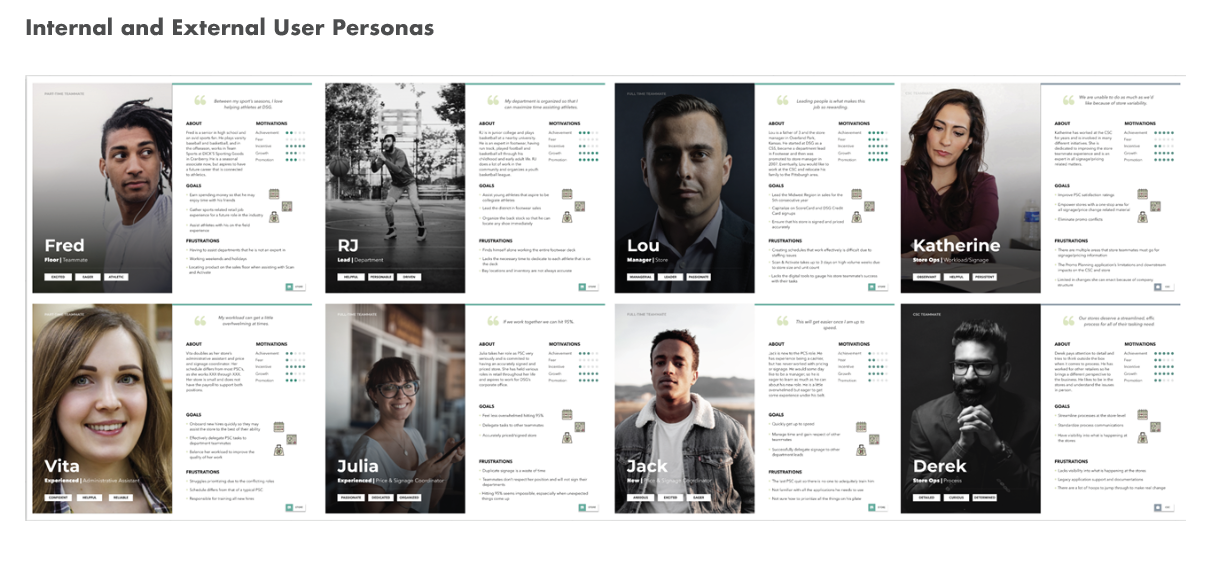
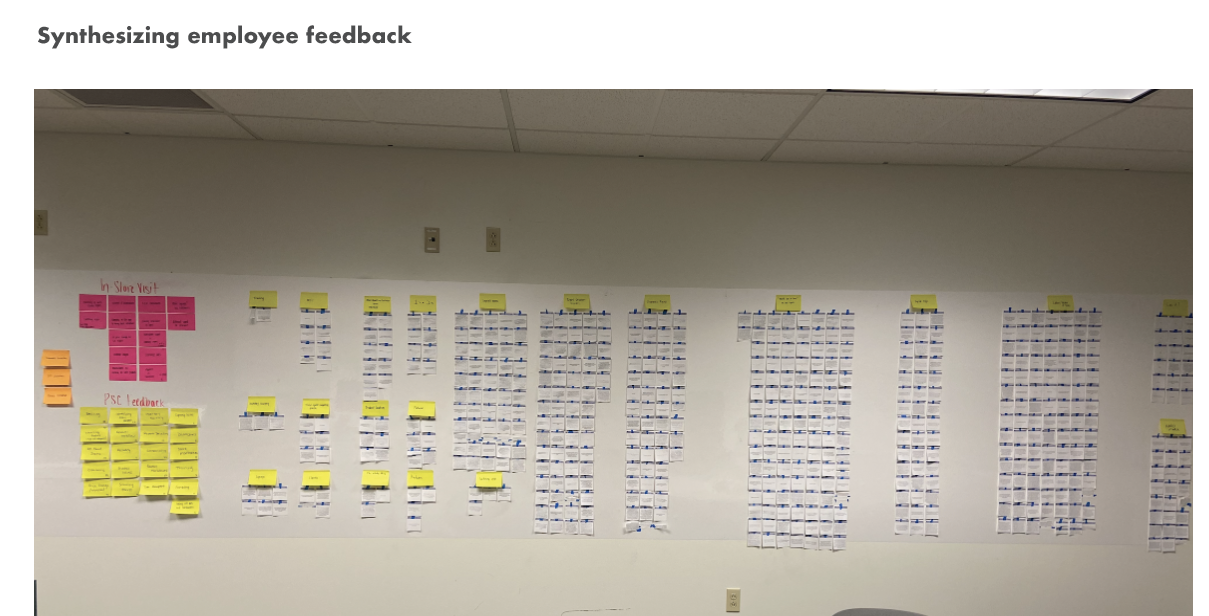
We gathered thousands of pieces of feedback and spent countless hours working in the stores alongside employees to truly empathize with their challenges and understand the issues they faced. Using this valuable information, we identified the broken processes and set out to create a more efficient solution. Employees were struggling with long task completion times and encountering many obstacles along the way.
In the following, I’ll showcase some of the design activities I conducted to collect insights, understand the problems, and prioritize improvements. As the sole designer on the team, I led these efforts alongside one product manager and a group of engineers. The project presented a significant opportunity, and we developed a solution that not only streamlined the process but also saved the company money. What was most rewarding was the positive feedback from employees, as it was a clear sign that our work made a real difference for them.
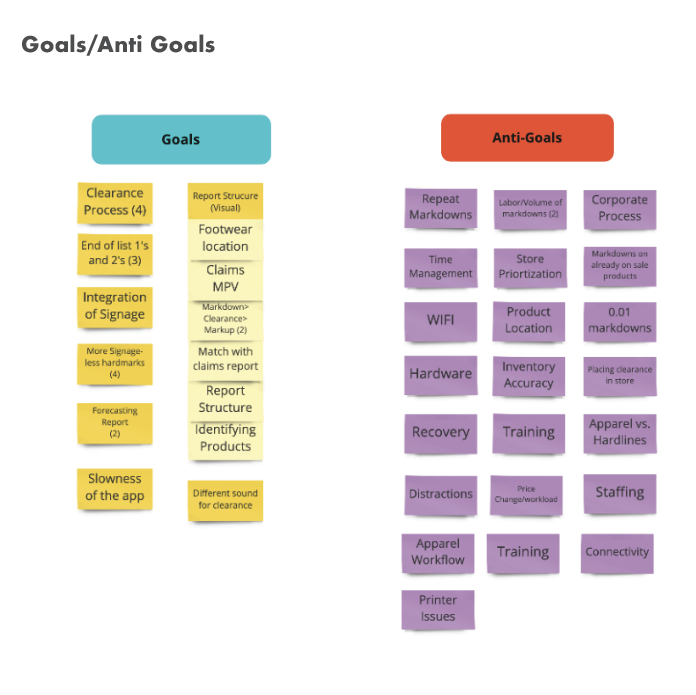
Output from a Goals/Anti-Goals session held with all stakeholders
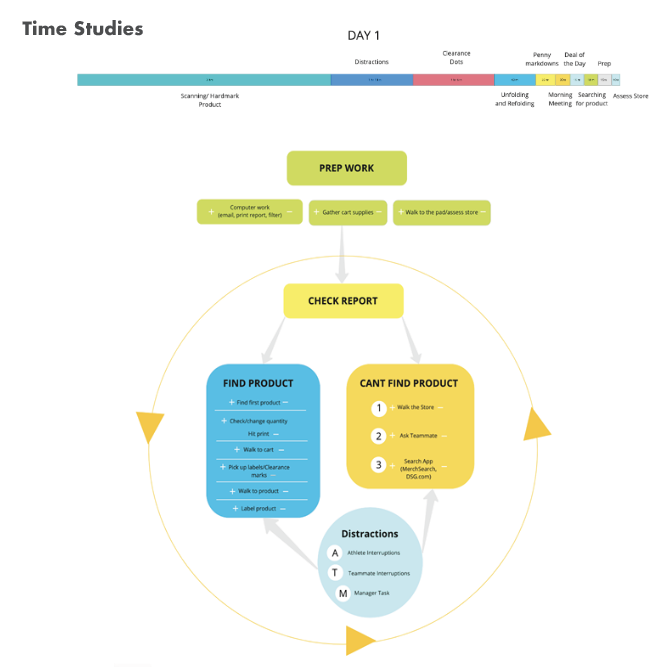
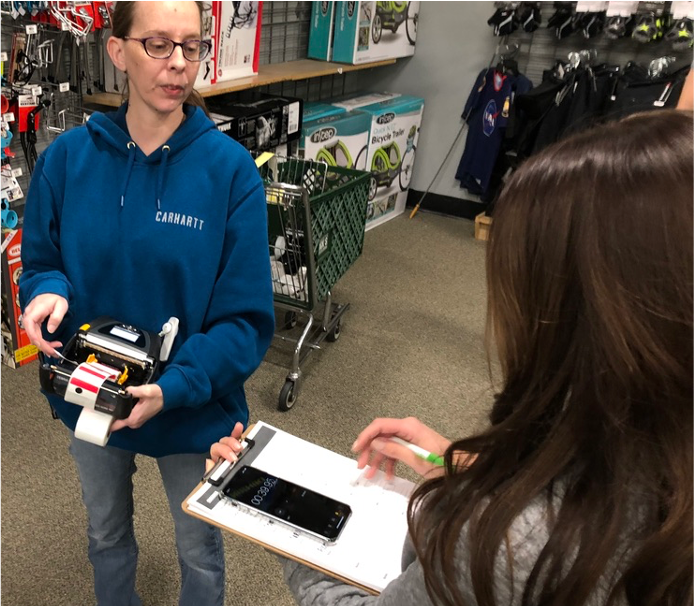
Many time studies were conducted to measure the labor savings.
UNDERSTANDING THE PROBLEMS AND OPPORTUNITIES
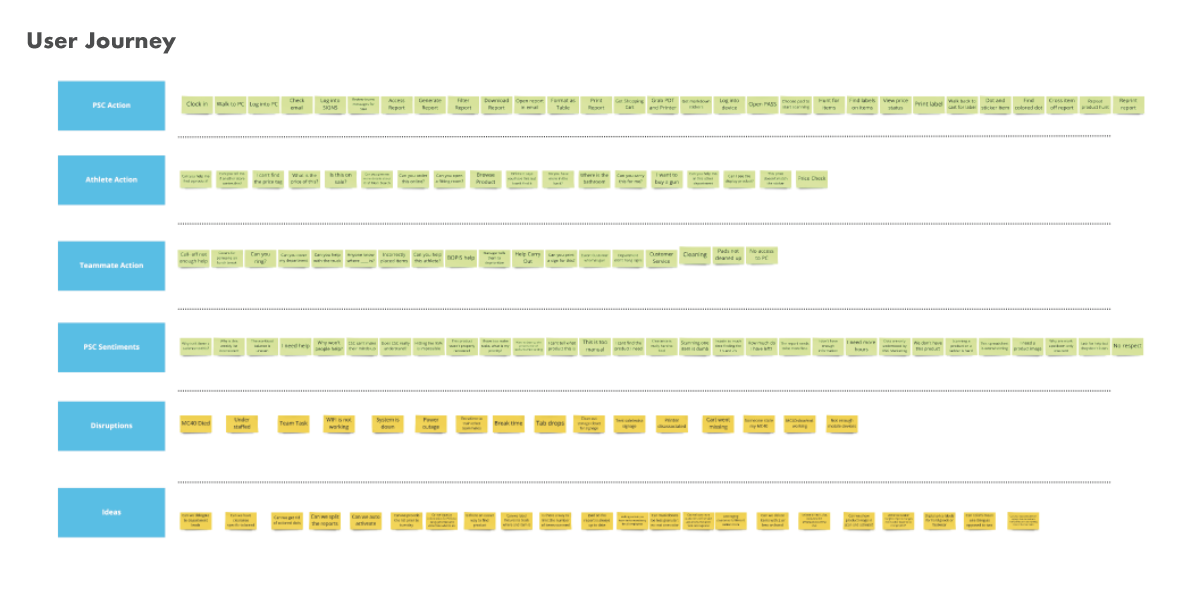
This process was a truly holistic discovery and framing activity. We needed to understand the internal reporting system, which contained thousands of data points that had to be communicated weekly. Our challenge was to take this complex data and present it in a way that was easy for any employee to understand and use effectively.
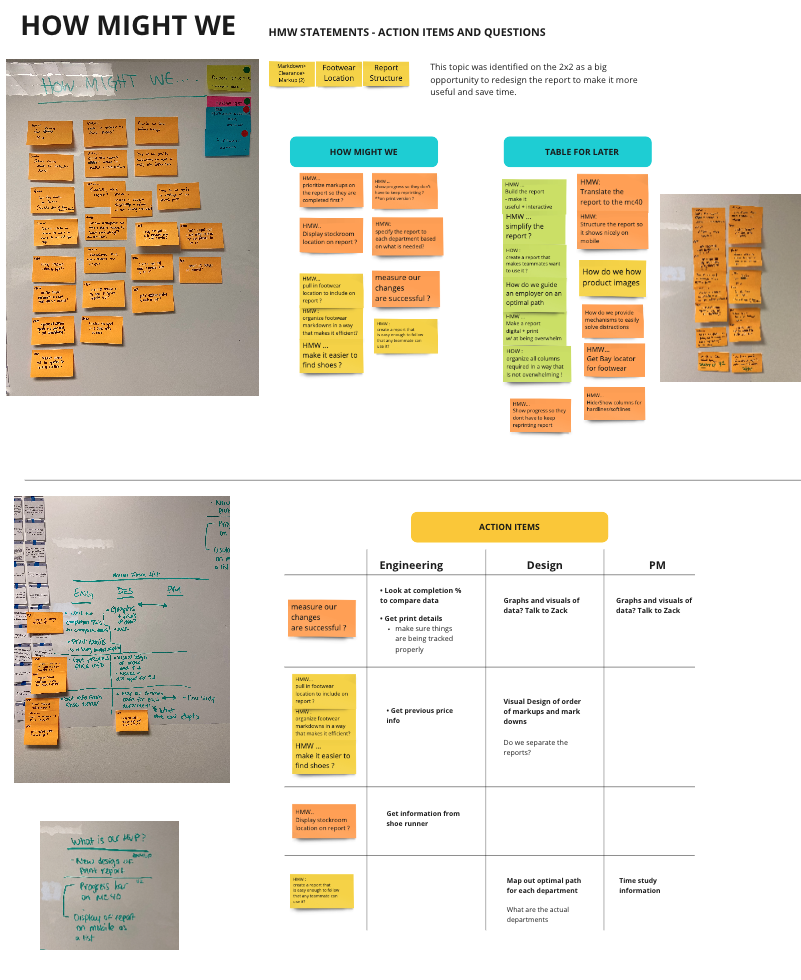
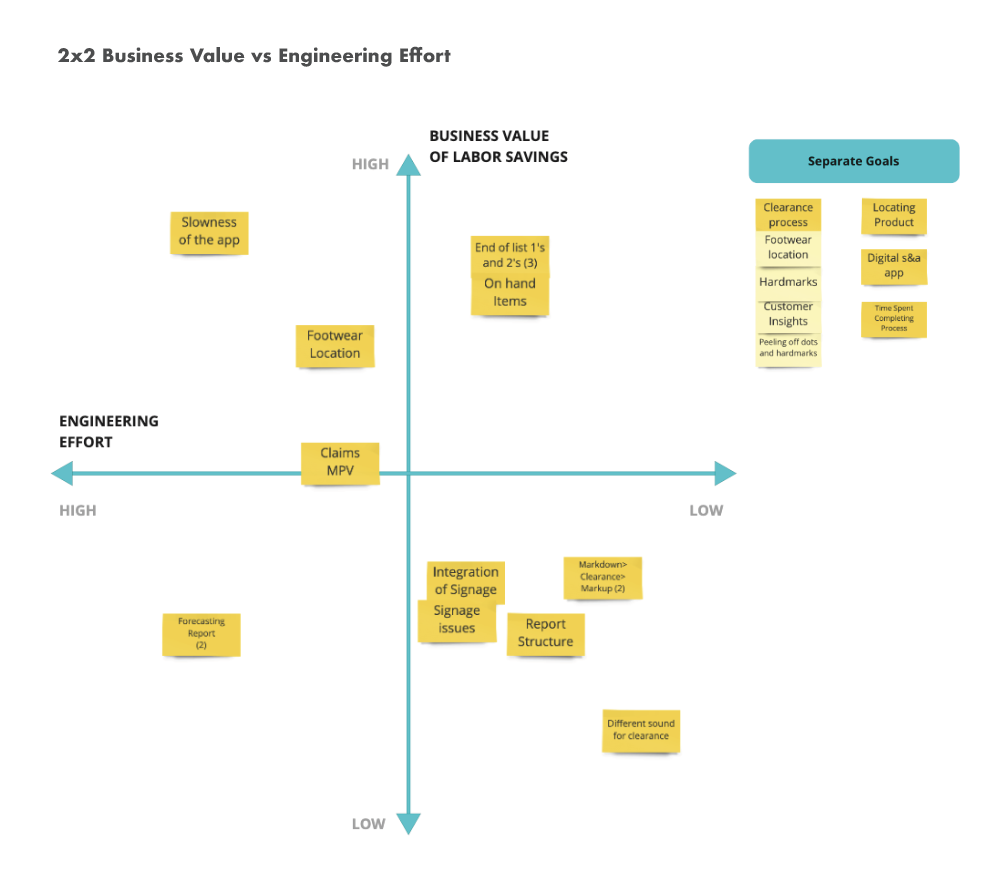
I used this activity to help my team to identify what we were going to tackle first and what features had the most value.
Time Studies and Feedback
RESULTS AND REFLECTION
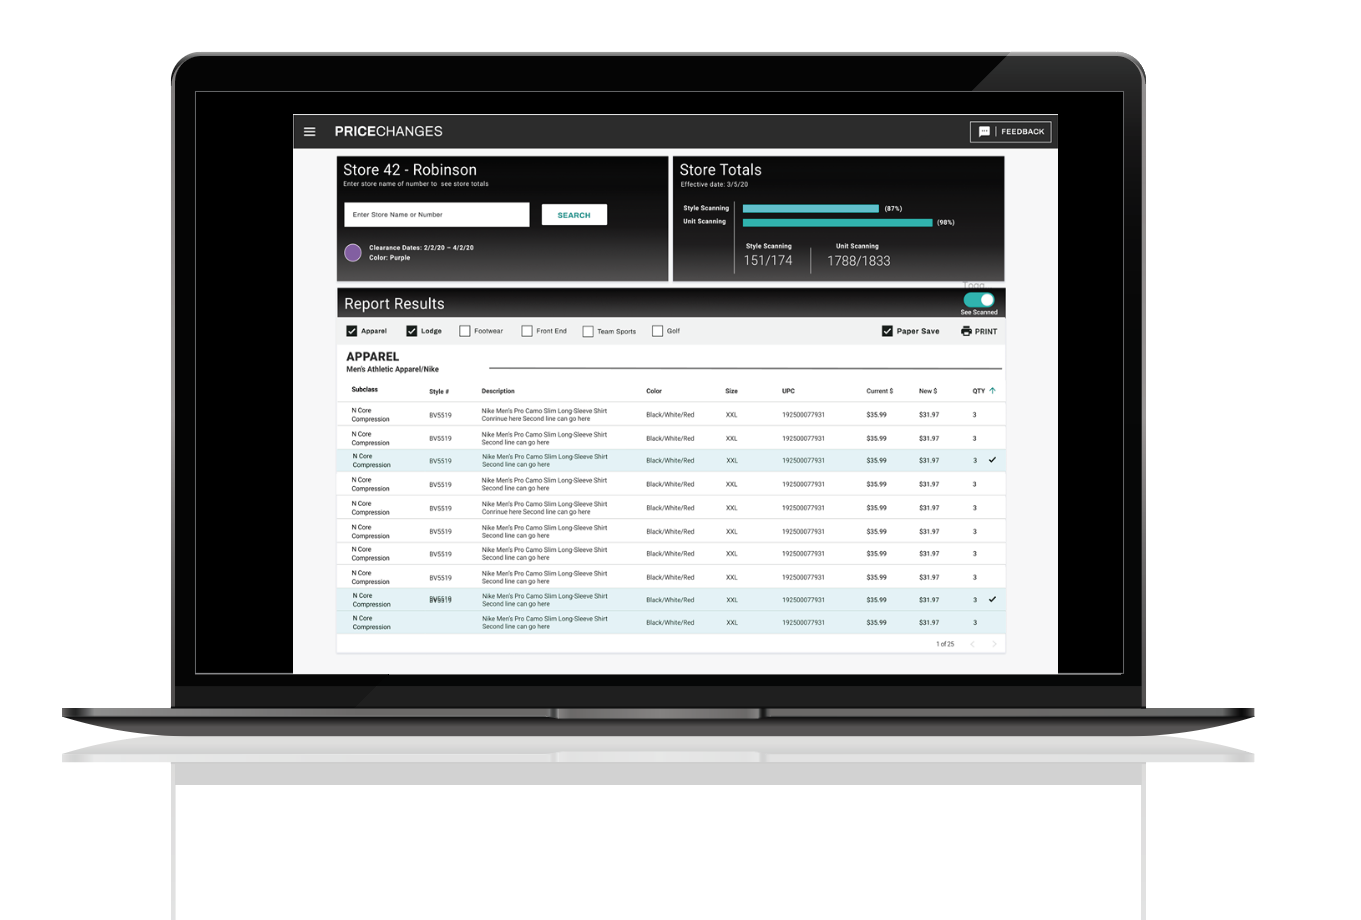
We ultimately developed a desktop application that allowed employees to filter and customize the report in a way that saved them both time and effort.
One key change we made led to impressive results: We discovered that the bay location for shoes was missing from the report, which was causing employees to take an additional three steps to locate each shoe (and there were over 100 shoes to process each week!). By adding this information to the report, we significantly streamlined their workflow and eliminated unnecessary search steps.arch to find one shoe (x100+ shoes per week)! So we had this information and added it to the report and…
Before:
3min. 23 sec. to find a shoe’s bay location
Avg. # of shoes on footwear week = 100
100 shoes x 3min. 23sec. = 6 hours 3 min
After:
1min. 5 sec. to find a shoe’s bay location
Avg. # of shoes on footwear week = 100
100 shoes x 1min. 5sec. = 2 hours 10 min
Across 756 stores, this change will save approximately 48,562 labor hours, resulting in an estimated $631,309 in labor savings per year—simply by adding one column of information to the report.
The positive feedback from employees has been overwhelming, and it’s clear we’ve significantly improved their work experience. They’ve transitioned from using a paper spreadsheet to an interactive interface that helps them efficiently find items, making their jobs easier and more effective.